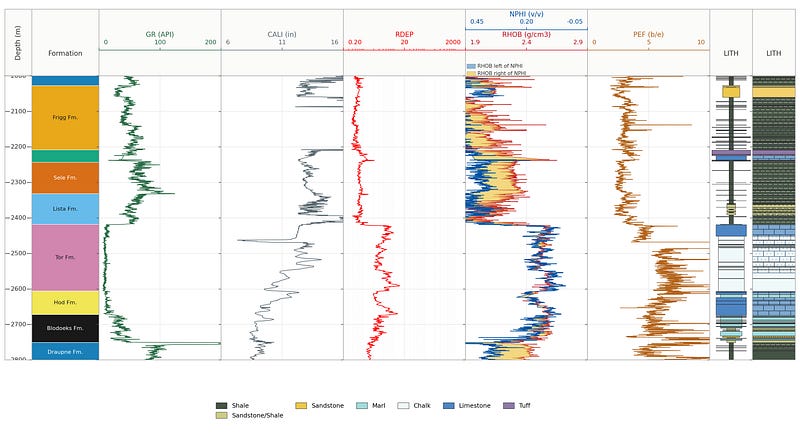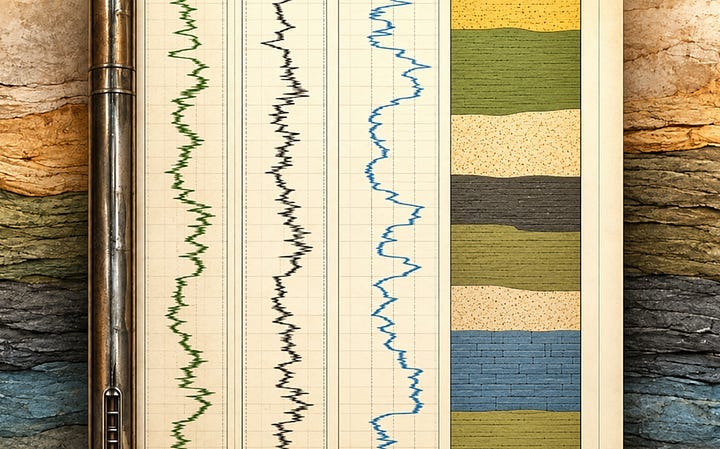
Adding a Geological Facies Display to a Well Log Plot in Matplotlib and Plotly
Adding a column of colour to a well log plot using Python
Read on Substack ↗Filtering by tag: python (30)
Adding a column of colour to a well log plot using Python
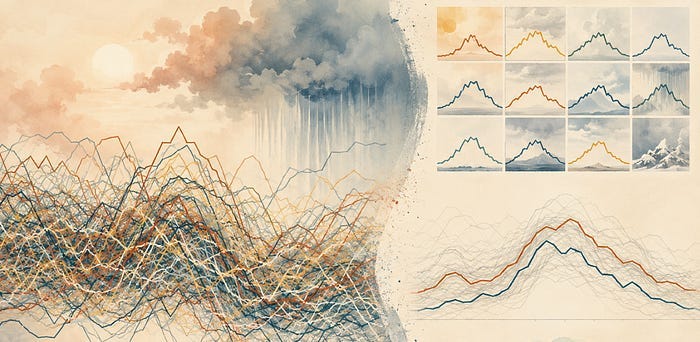
Read on Substack ↗Past a handful of series, a line chart stops letting you follow any of them. Here is what breaks and what to plot instead
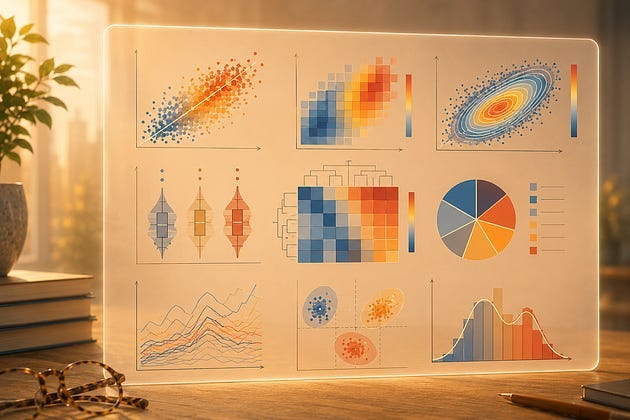
Read on Substack ↗Every chart has a blind spot. Learn where common scientific visualisations start to hide the patterns that matter.
Read on Substack ↗Overplotting is easy to miss and easy to fix, once you stop asking your chart to show every point.
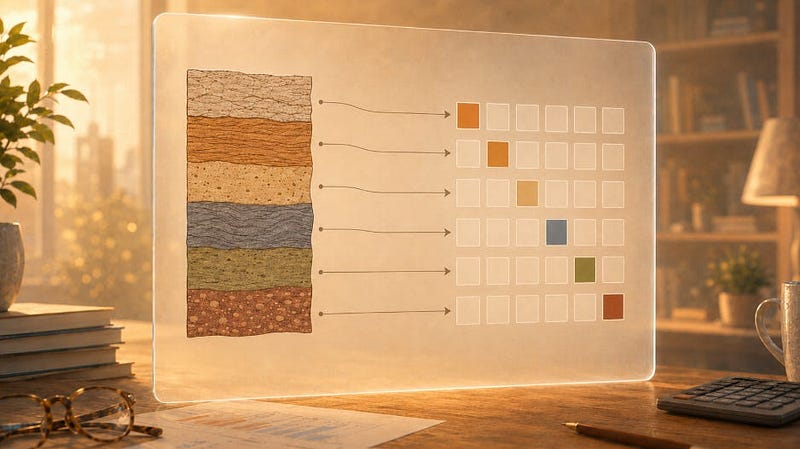
Read on Substack ↗What label, ordinal, and one hot encoding each tell a model about your rocks
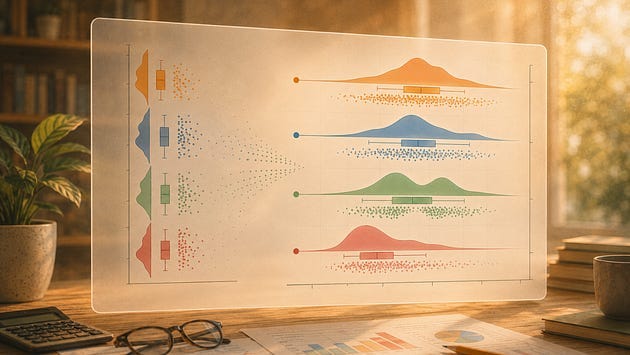
Read on Substack ↗Six steps between the chart ptitprince gives you and one you would want to put in a report
Read on Substack ↗Working code is only half the job. The reasoning needs to be readable too.
Read on Substack ↗Small habits that make notebooks easier to rerun and share
Read on Substack ↗How overlaying raw data points reveals what your summary statistics quietly discard
Read on Substack ↗A lightweight workflow for keeping notebook-heavy projects searchable, readable, and easy to return to
Read on Substack ↗Seven Steps From a Default Chart to Something Worth Publishing
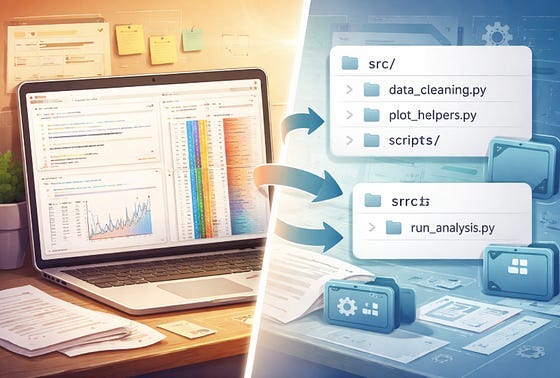
Read on Substack ↗Notebooks are great for thinking. They are not always the right place to keep the machinery
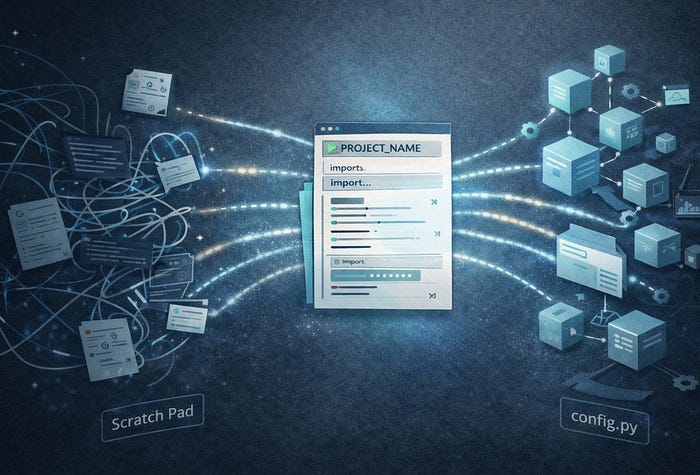
Read on Substack ↗Set it up once. Use it on every project.
Read on Substack ↗From messy exploration to a record that still makes sense months later
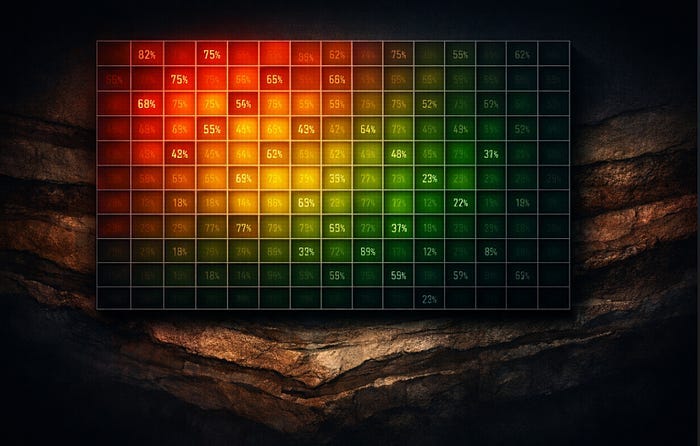
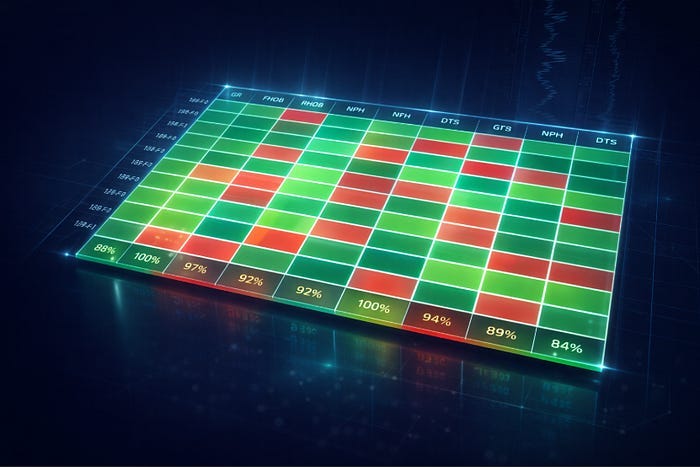
Read on Substack ↗Visualising Well Log Data Availability by Formation Across Multiple Wells
Read on Substack ↗Three underused chart types and when to reach for them when working with well log data
Read on Substack ↗Take a Basic Well Log Data Availability Heatmap and Make It Something Worth Putting in a Report
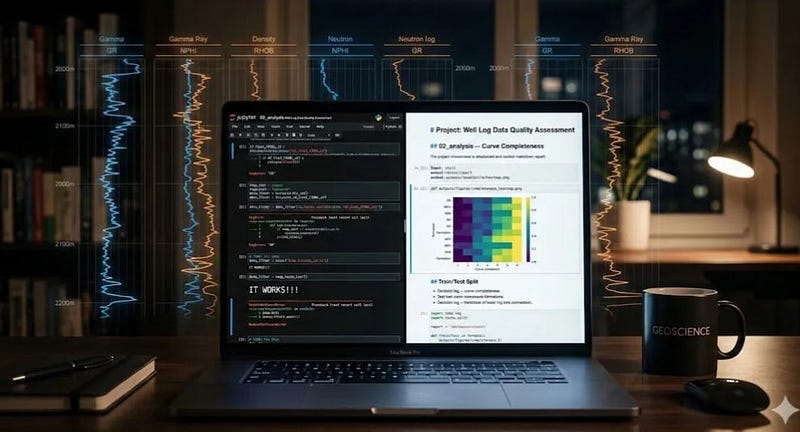
Read on Substack ↗Building a coverage heatmap for LAS files using rich and lasio
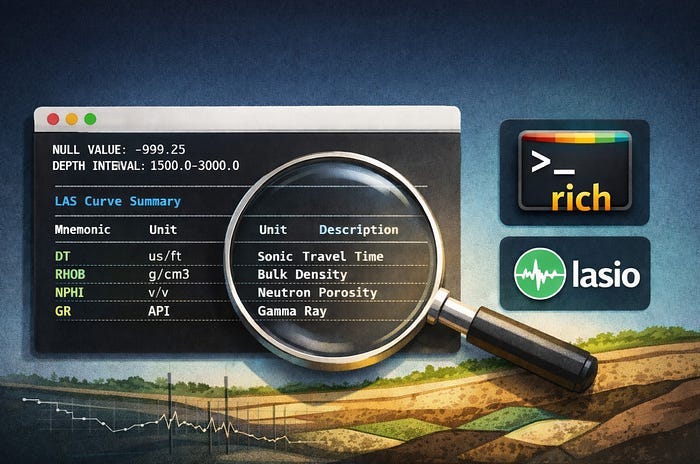
Read on Substack ↗A practical approach to inspecting LAS files in Python without jumping straight to plots
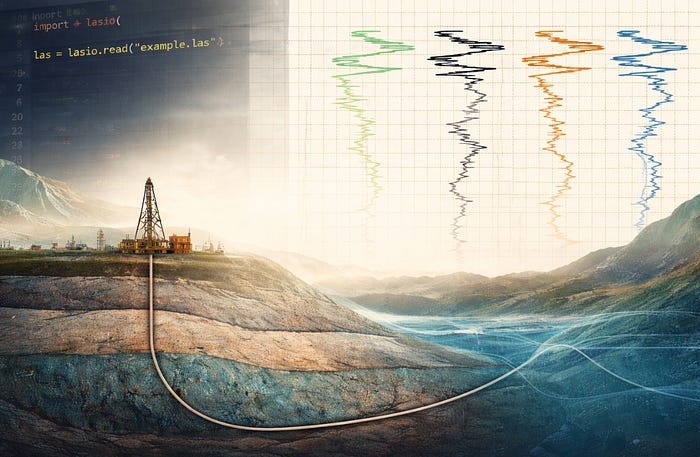
Read on Substack ↗A practical look at the LAS format, its structure, and how to work with it using lasio for subsurface well data
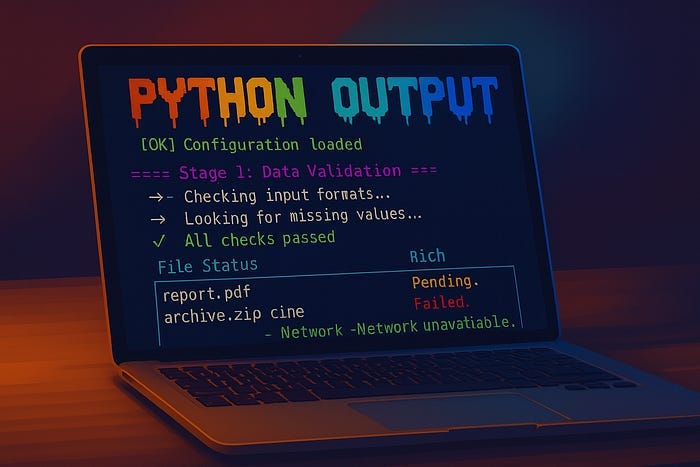
Read on Substack ↗Three simple libraries to make console output readable, useful and even stylish
Read more →Two lightweight tools that help you see what your code is doing without the clutter or confusion of print statements
Read on Substack ↗4 Ways to Enhance Your Python Terminal Output
Read on Substack ↗A quick guide to building a flexible, collapsible navigation sidebar using Dash Bootstrap Components.
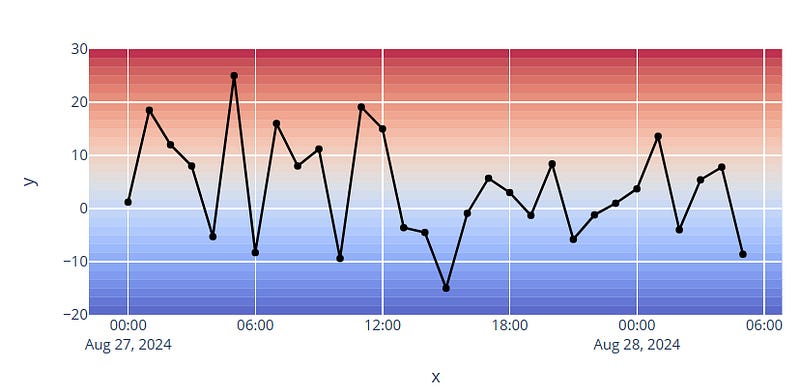
Read on Substack ↗Using Plotly rectangle shapes to improve data visualisation
Read on Substack ↗A simple way to understand parameters to the Archie Water Saturation equation using Python
Read more →How Python can help your daily subsurface geoscience workflows
Read more →Improve how you view your dataframes by changing Pandas' display options
Read more →A short tutorial on loading and displaying processed acoustic waveform data using dlisio and matplotlib
Read more →