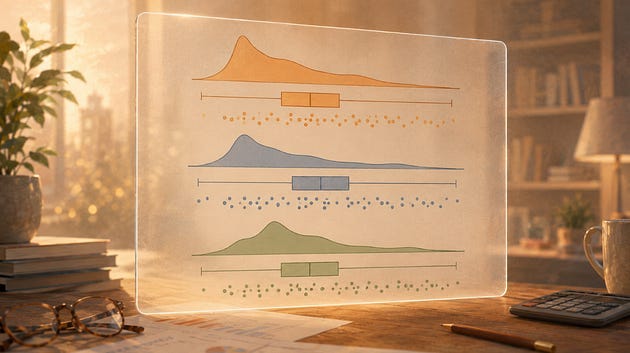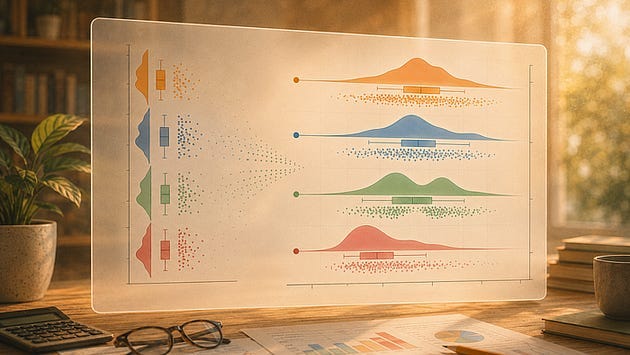
6 Ways to Customise Your Raincloud Plot
Splitting, highlighting, connecting means, tuning the cloud, styling the rain, and knowing when to go vertical
Read on Substack ↗Filtering by tag: geoscience (12)
Splitting, highlighting, connecting means, tuning the cloud, styling the rain, and knowing when to go vertical
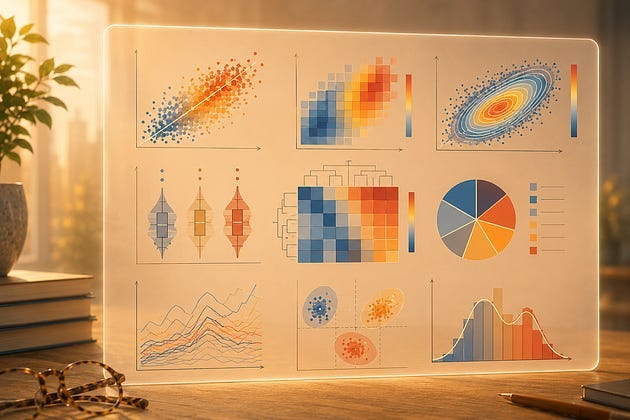
Read on Substack ↗Every chart has a blind spot. Learn where common scientific visualisations start to hide the patterns that matter.
Read on Substack ↗Constructing a raincloud plot one layer at a time
Read on Substack ↗Small habits that make notebooks easier to rerun and share
Read on Substack ↗How overlaying raw data points reveals what your summary statistics quietly discard
Read on Substack ↗Seven Steps From a Default Chart to Something Worth Publishing
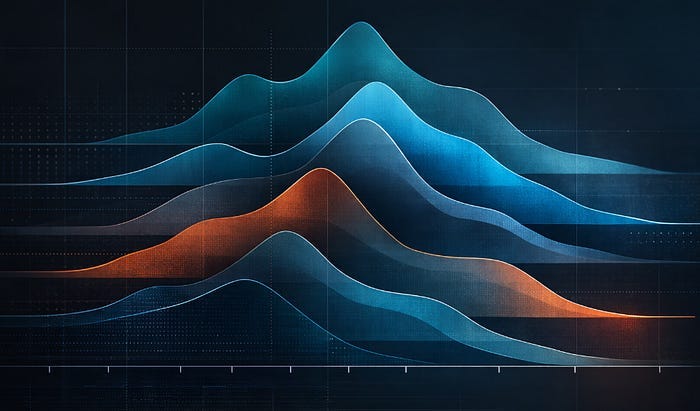
Read on Substack ↗Build stacked KDE plots from scratch and with joypy to show shape, skew, and spread across multiple groups
Read on Substack ↗Why missing specifications can result in behavioural drift in technical workflows
Read on Substack ↗Three underused chart types and when to reach for them when working with well log data
Read on Substack ↗Building a coverage heatmap for LAS files using rich and lasio
Read on Substack ↗How Python can help your daily subsurface geoscience workflows
Read more →