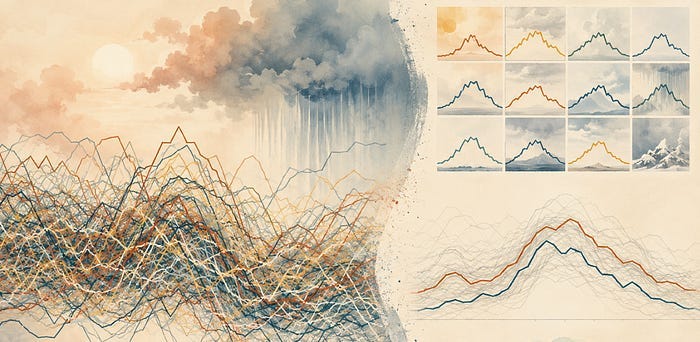
When a Line Chart Becomes Spaghetti
Past a handful of series, a line chart stops letting you follow any of them. Here is what breaks and what to plot instead
Read on Substack ↗Filtering by tag: data science (8)
Past a handful of series, a line chart stops letting you follow any of them. Here is what breaks and what to plot instead
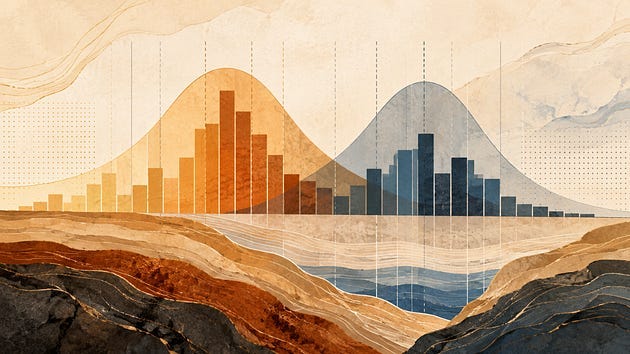
Read on Substack ↗How the number and position of bins can change what you think the distribution is telling you
Read on Substack ↗Overplotting is easy to miss and easy to fix, once you stop asking your chart to show every point.
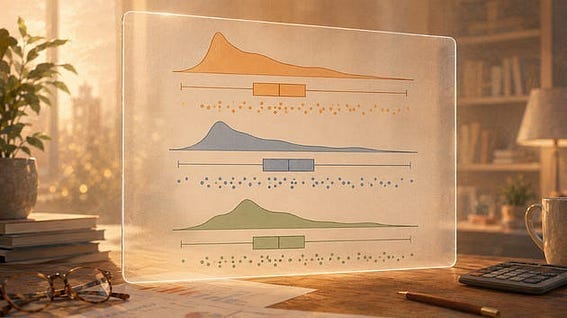
Read on Substack ↗Three views of your data distribution in one function call
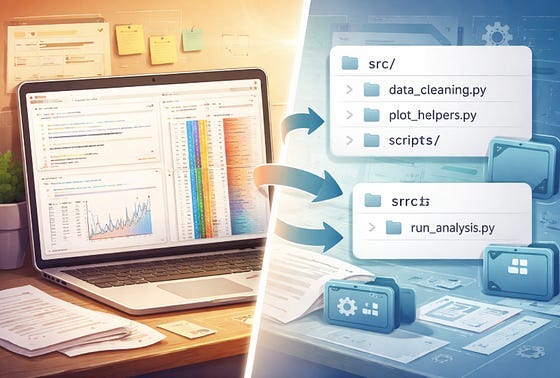
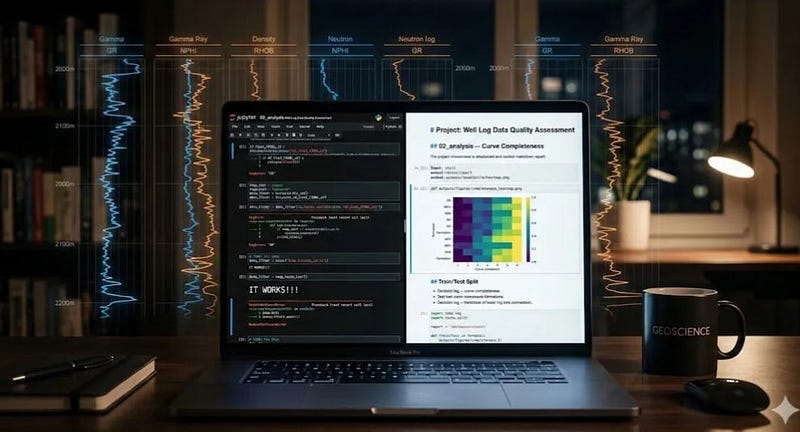
Read on Substack ↗A lightweight workflow for keeping notebook-heavy projects searchable, readable, and easy to return to
Read on Substack ↗Notebooks are great for thinking. They are not always the right place to keep the machinery
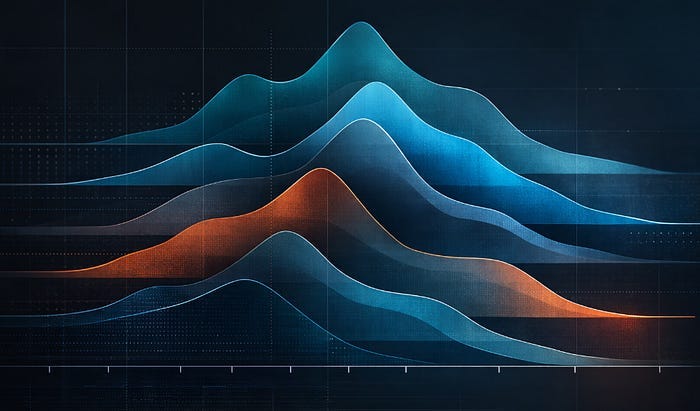
Read on Substack ↗Build stacked KDE plots from scratch and with joypy to show shape, skew, and spread across multiple groups
Read on Substack ↗From messy exploration to a record that still makes sense months later
Read on Substack ↗