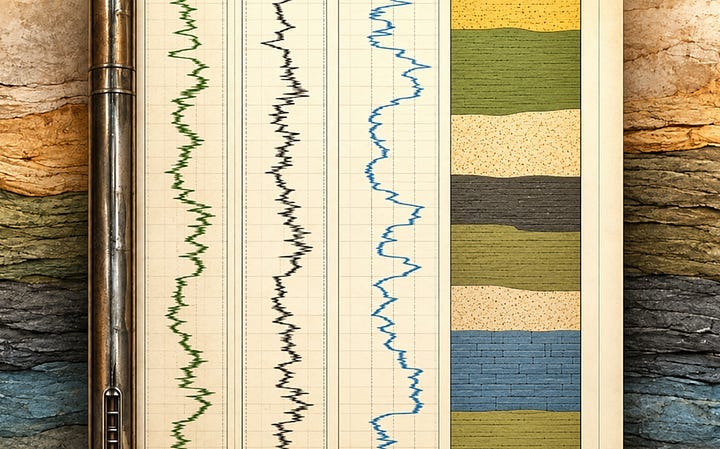
Adding a Geological Facies Display to a Well Log Plot in Matplotlib and Plotly
Adding a column of colour to a well log plot using Python
Read on Substack ↗Filtering by tag: data analysis (12)
Adding a column of colour to a well log plot using Python
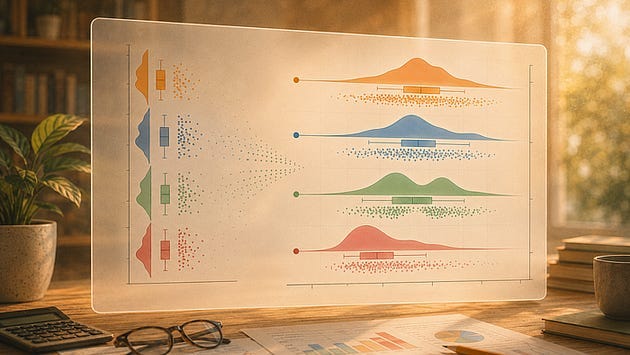
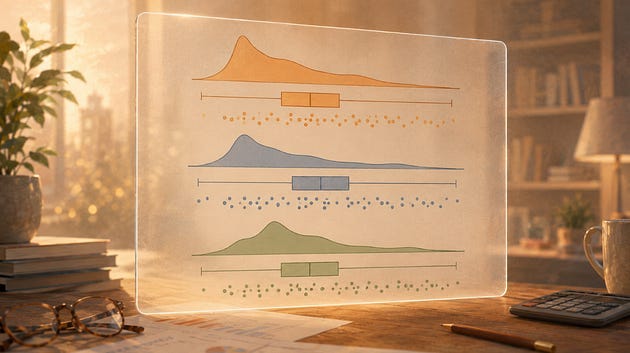
Read on Substack ↗Splitting, highlighting, connecting means, tuning the cloud, styling the rain, and knowing when to go vertical
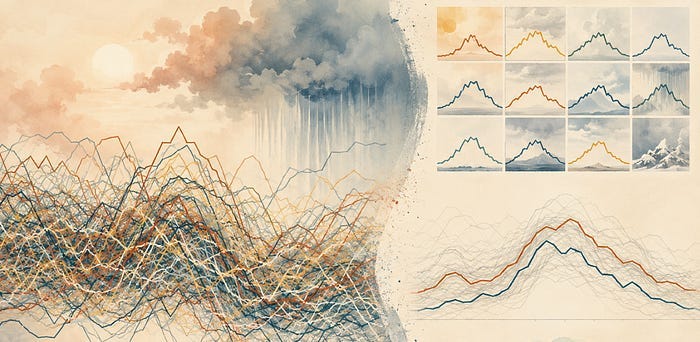
Read on Substack ↗Past a handful of series, a line chart stops letting you follow any of them. Here is what breaks and what to plot instead
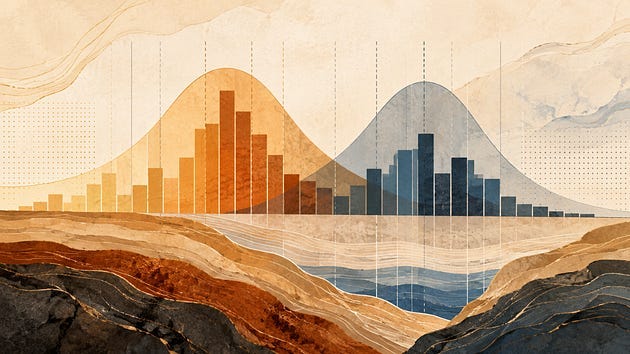
Read on Substack ↗How the number and position of bins can change what you think the distribution is telling you
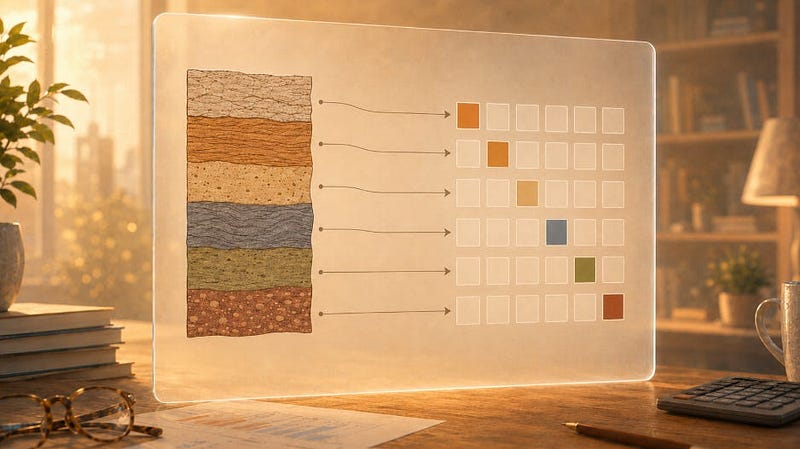
Read on Substack ↗What label, ordinal, and one hot encoding each tell a model about your rocks
Read on Substack ↗Constructing a raincloud plot one layer at a time
Read on Substack ↗How overlaying raw data points reveals what your summary statistics quietly discard
Read on Substack ↗Seven Steps From a Default Chart to Something Worth Publishing
Read on Substack ↗Notebooks are great for thinking. They are not always the right place to keep the machinery
Read on Substack ↗Build stacked KDE plots from scratch and with joypy to show shape, skew, and spread across multiple groups
Read on Substack ↗Set it up once. Use it on every project.
Read on Substack ↗From messy exploration to a record that still makes sense months later
Read on Substack ↗